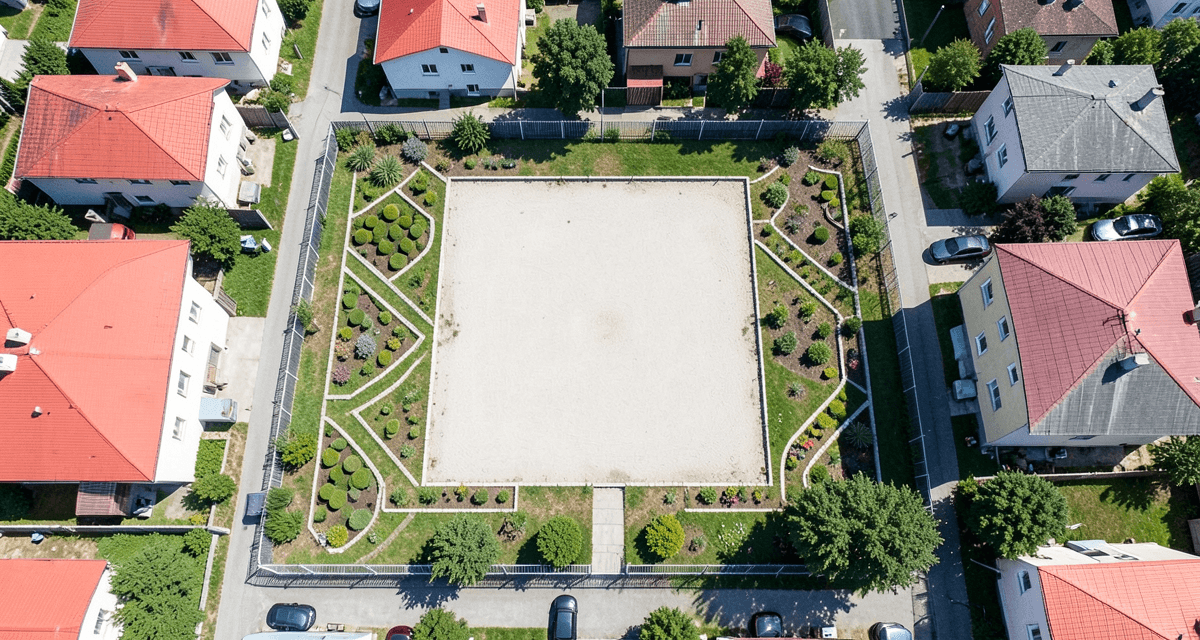
The traditional analysis: weeks of waiting and thousands of zloty
Before a house can be designed, the investor needs to know what is actually allowed to be built on a given plot. Traditionally, answering that question means hiring an urban planner or architect who manually reviews the local zoning plan (MPZP / miejscowy plan zagospodarowania przestrzennego) or the zoning conditions decision (WZ / decyzja o warunkach zabudowy), the neighbouring development, the utilities and a dozen other factors.
Such an analysis typically costs PLN 3,000 to 8,000 (roughly EUR 700–1,900) and takes 2 to 6 weeks. The planner collects documents from several offices, checks the land and building registers, and draws protection zones and distances from the boundaries. Every step means a separate query to a different government system, and the results then have to be combined by hand.
For a real estate agent handling a dozen plots a month, that process is inefficient. For a developer screening dozens of potential locations, it is expensive. For a private buyer, and especially for a foreigner purchasing their first plot in Poland, it is opaque and stressful. Each of them needs a quick, reliable answer: can I build on this plot what I have in mind?
Zabudowa.com.pl automates this process. The whole pipeline, from a plot number to a PDF report, takes about 2 minutes.
From plot number to report: 10 steps in 2 minutes
You only need to enter the cadastral plot number (for example 142104_2.0013.608/3), and the system runs an automatic analysis in ten steps. (The tool interface is currently in Polish.)
- 1. Fetching the plot geometry (ULDK) — the system queries the Cadastral Plot Location Service (ULDK, Usługa Lokalizacji Działek Katastralnych) run by GUGiK, the national geodesy and cartography authority. It returns the exact outline of the plot, its area and its position.
- 2. Checking the local zoning plan (MPZP) — the system searches municipal WFS services (Poznań, Wrocław, Kraków, Gdańsk and more) to see whether the plot is covered by a local zoning plan. If the plan exists only as a scan, an AI-based OCR module kicks in.
- 3. Building parameters — if there is no MPZP, the user can upload a WZ decision (the system reads the parameters via OCR) or enter them manually. You will find more about these parameters in our guide to zoning conditions decisions.
- 4. Neighbourhood analysis (BDOT10k) — the Topographic Objects Database provides information on buildings, roads, forests and water within 200 m of the plot. The system analyses 2.4 million objects from 24 counties.
- 5. Flood zones (ISOK) — the system pulls data from the IT System of the Country's Protection (ISOK) and checks whether the plot lies in a Q10, Q100 or Q500 flood risk zone.
- 6. Utilities (KIUT) — detection of water, sewer, electricity and gas networks near the plot, based on GUGiK's WMS visualisation.
- 7. Generating building variants — an algorithm creates optimal building variants that fit within the permitted parameters: building coverage, building intensity, height, building line, distances from boundaries and roof geometry.
- 8. Verification against 50+ compliance rules — an automatic rules engine checks each variant against the regulations: the 4 m and 3 m distances from boundaries, the building line, intensity ratios, infrastructure and the neighbourhood.
- 9. PDF report and DXF export — the system generates a multi-page report with building dimensions (according to the Polish standard PN-B-01029), a site development plan and floor plans.
- 10. Variant editing — the user can move or rotate the building on an interactive map and add infrastructure (parking, greenery, access road), while the rules recalculate live.
All of this is possible thanks to integration with public geodetic registers: the same data an urban planner uses, only fetched and analysed automatically. You can read more about the legal changes affecting this process in our article on the 2026 planning reform.
Where the data comes from
Every analysis on Zabudowa.com.pl is based on public geodetic data from state registers. We do not create our own data: we download it from official sources and process it automatically.
- ULDK (GUGiK) — the Cadastral Plot Location Service. It provides plot geometry, cadastral numbers and area data. It is the same source that Geoportal uses.
- BDOT10k — the Topographic Objects Database at a 1:10,000 scale. It contains buildings, roads, forests, water, built-up areas and other topographic features. The data is made available free of charge by GUGiK under the Geodetic and Cartographic Law.
- ISOK — the IT System of the Country's Protection, run by Wody Polskie (Polish Waters). Flood hazard maps with three scenarios (Q10, Q100, Q500) and data on flood embankments.
- MPZP WFS — municipal geoportal services that publish local zoning plans as vector data (GML/GeoJSON). The system connects to the registers of Poznań, Wrocław, Kraków, Gdańsk and other cities.
- KIUT (GUGiK) — a visualisation of the utility network routes (water, sewer, electricity, gas, telecommunications) based on a WMS service.
All sources are kept up to date by state institutions. The system caches data in Redis and a PostGIS database to speed up subsequent analyses of the same area. If you are planning to buy a plot, it is worth knowing what else to check before you decide.
Building variants and 50+ compliance rules
Once the data is collected, the system moves to the most important stage: generating building variants. The algorithm searches the space of possible solutions, taking all parameters into account at once: building coverage, building intensity (intensywność zabudowy), building height, the mandatory building line, minimum distances from the plot boundaries and the roof geometry (pitch angle and ridge direction).
The generator works in two modes. Grid search systematically tests different combinations of building dimensions and positions on the plot, looking for the variant that maximises usable floor area. The max generator calculates the largest permissible building that satisfies all constraints at the same time. The resulting variants are ranked from the most to the least favourable.
Each variant then goes through a compliance engine of more than 50 rules. The rules fall into five categories:
- Distances — at least 4 m from a boundary for walls with windows, 3 m from a boundary for walls without windows, distance from a forest (12 m / 16 m), distance from a road.
- Development parameters — compliance with the permitted building coverage, intensity, height and number of storeys.
- Building line — checking whether the building respects the mandatory or the non-exceedable building line.
- Infrastructure — access to a public road, utilities, parking spaces and the share of green area.
- Neighbourhood — compatibility with the surrounding development, flood zones and protected areas.
Every rule returns a result: PASS (requirements met), FAIL (violation) or WARNING (needs attention). The user sees the full list of rules with descriptions, so it is clear exactly what complies and what needs to be corrected.
PDF report and DXF export
The result of the analysis is a multi-page PDF report that you can download, print and pass on to an architect or a mortgage adviser. The report contains:
- Plot data — cadastral number, area, location, municipality and voivodeship (province).
- Development parameters — the source (MPZP or WZ), permitted intensity, building coverage, height, roof geometry and building line.
- Site development plan (PZT) — a map with 19 layers: building outline, plot boundaries, roads, greenery, parking, utility networks, flood zones and distances from boundaries.
- Building plan with dimensions — dimensioning in line with the Polish standard PN-B-01029, with text parallel to the edges and automatic selection of the dimension side (taking obstacles in the drawing into account).
- Verification results — a list of detected violations and warnings from the 50+ compliance rules, allowing you to spot problems quickly.
For architects and designers there is also a DXF export, a CAD format that opens in AutoCAD, ArchiCAD or BricsCAD. The DXF file contains 19 PZT layers (using Polish drawing conventions), dimensions of the building edges and infrastructure, and an information block with the plot parameters. It is a preliminary starting point for further design work.
The PDF report is useful at three stages: when buying a plot (assessing its investment potential), when commissioning a design (the architect gets a complete set of input data) and when applying for a loan (the bank can see what can be built on the collateral).
Check your plot now
The basic plot analysis on Zabudowa.com.pl is free: up to 3 analyses per month at no charge. Enter the cadastral plot number and within 2 minutes the system delivers a preliminary zoning analysis, with building variants, verification results and a PDF report.
You do not have to be an architect or an urban planner to understand the results. Every rule has a plain-language description, and the building variants are shown on an interactive map. You can move the building, change its dimensions, add parking and greenery, and the system recalculates compliance with the regulations on the fly.
Go to the plot analysis (interface in Polish): enter the plot number and see what you can build. If the results look promising, the next step might be a conversation with an architect, since the PDF and DXF files are ready-made input data.
Have questions about your results? Write to us and we will gladly help you interpret the report. We are working to make zoning analysis accessible to everyone planning to build in Poland.
Check your plot
Enter the plot number and find out in 2 minutes what you can build on it. Free, no sign-up. (The analysis tool is in Polish and covers Polish plots.)
Analyze a plot for freeRelated articles
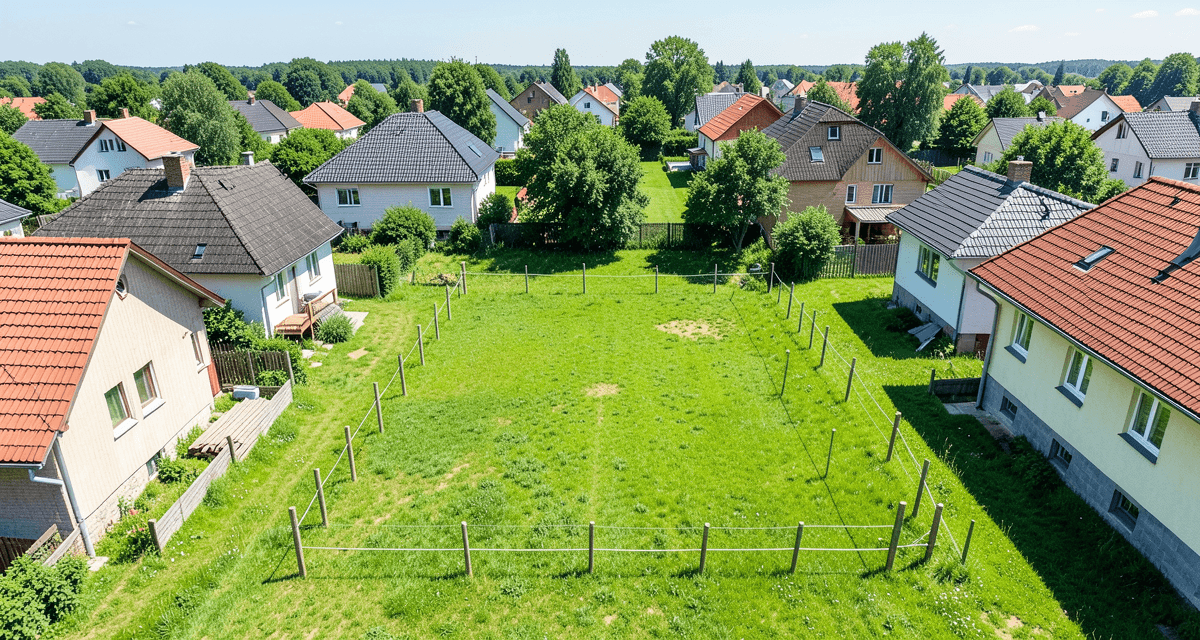
Zoning Conditions in Poland (WZ) 2026: The Complete Guide
What a zoning conditions decision (WZ) is in Poland, how to apply, what it costs and how long it takes. Parameters, urban analysis and the 2026 reform.
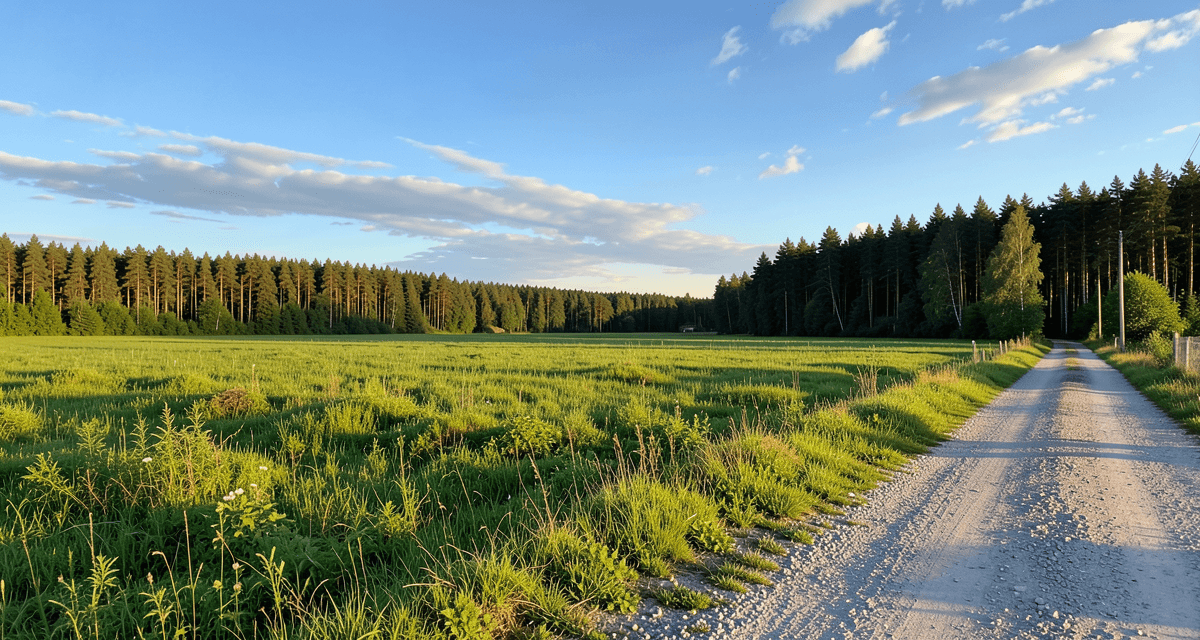
Buying Land in Poland: 12 Checks That Can Save You Thousands
A 12-point checklist for buying building land in Poland: local zoning plan, zoning conditions, utilities, road access, soil, flood risk and land register.
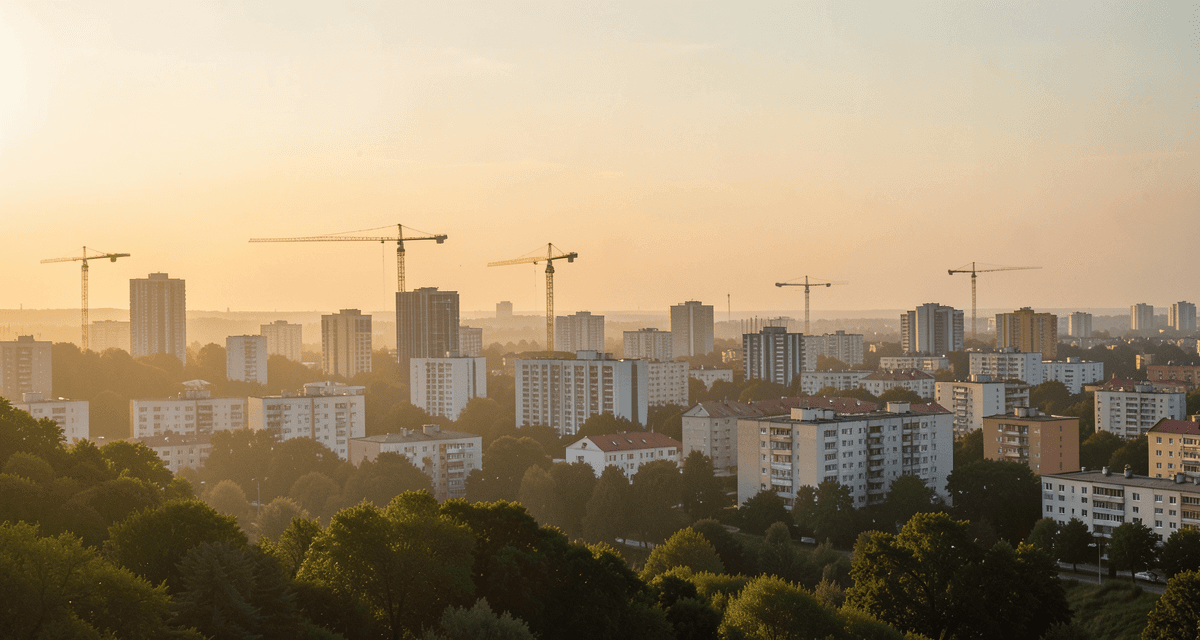
Poland’s 2026 Planning Reform — 3 Dates That Change the Property Market
Poland’s 2026 planning reform: zoning decisions valid for 5 years, mandatory municipal general plans, no more open-ended approvals. The 3 key dates explained.